In earlier posts, we discussed two bullish reversal patterns- The Hammer pattern and the bullish engulfing pattern. Today we will talk about another bullish reversal pattern called the Piercing pattern. Like the engulfing pattern, a piercing pattern is also a two-candlestick pattern.
This post will be divided into three sections. In the first section, we will learn about the formation of piercing patterns. This will be followed by the psychology behind the pattern in the second section and lastly, we will learn how to trade a piercing pattern in the third section.
Let's get started.
What is a Bullish Piercing candlestick pattern?
A Bullish Piercing candlestick is a bullish reversal pattern. The pattern forms after a downtrend.
The first candle is a red candle. The second candle opens below the close of the first candle but closes above the midpoint of the body of the first candle.
Both the candles need to have relatively large bodies with smaller wicks.
The pattern becomes more important if it forms near a support level.
See the schematic diagram below to understand this pattern.
 |
| Schematic diagram of Bullish Piercing Candlestick Pattern |
Let's see this bullish reversal pattern in a chart now.
Now that you know what a bullish piercing pattern looks like, let's move on to understand the psychology behind this pattern.
The Psychology behind the Bullish Piercing Candlestick pattern-
Every candlestick mirrors the psychology of traders and so does the piercing pattern.
The prevailing trend before this pattern forms is down. The sentiments are bearish. The first candle of this pattern is a red candle which suggests a continuation of bearish sentiments.
The second candle opens below the close of the previous candle solidifying the bearish position.
But soon buyers take over and push prices up.
The final closing of the second candle above the midpoint of the body of the previous candle suggests buyers have fair control now but require further buying to sustain this bullish move.
Now that you have understood the piercing pattern and the psychology behind it, let's move on to understand how to trade this pattern once you encounter this pattern in a chart.
How to trade a Bullish Piercing Candlestick Pattern-
 |
Though the bullish piercing pattern shows bullish sentiments it requires further thrust in order to sustain this bullish move.
So, it is not advisable to enter a buy trade right away after spotting this pattern.
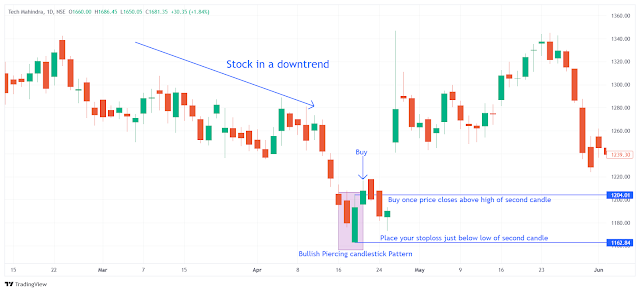
Once you have encountered this pattern, you should draw a line at the high and low of the second candle.
You enter a buy trade once the price closes above the high of the second candle with stop loss placed just below the low of this candle. As shown alongside.
Now let me demonstrate this with the help of a chart.
A word of caution here. The piercing pattern should not be traded as a standalone signal and other indicators must be looped in to get additional insight into the price movements. For example, a momentum indicator showing increasing momentum and RSI coming out of the oversold zone as the pattern is formed can be a better trading decision.
Similarly, a money flow indicator showing increasing buy pressure as the pattern is formed gives an additional signal to go for a buy.
The Bottom Line-
1) A Bullish Piercing Candle stick is a bullish reversal pattern.
2) There should be a prevailing downtrend.
3) The first candle is red in line with the prevailing trend.
4) The next candle opens below the close of the previous candle but closes above the midpoint of the body of the previous candle forming the bullish piercing pattern.
5) A bullish piercing pattern is traded once the price closes above the high of the second candle with a stop loss placed just below the low of the second candle.
6) Other indicators should also be in sync with the pattern to make better trading decisions.


Post a Comment