In an earlier post, we talked about the Hammer Candlestick pattern and a strategy to trade it. Today we will discuss another bullish reversal pattern- the bullish engulfing pattern. Similar to the previous post we will learn and seek answers to questions like, What is a Bullish engulfing pattern, the psychology behind this pattern, and how to trade this candlestick pattern.
Now let' see this pattern in charts to have a better idea about this reversal pattern.
A word of caution here. Though the Engulfing pattern is an extremely bullish signal before entering a trade you should make sure that other indicators like momentum indicators, volume indicators, and general price action are in agreement.
Let's get started.
What is a Bullish Engulfing Pattern?
A bullish engulfing pattern is a two-candle bullish reversal pattern. The first candle is a red candle that is in continuation with the prevailing downtrend. The first candle can be of any length but it should not be a Doji as it is easier to engulf.
The second candle is a green candle that opens below the previous day's close and then closes above the previous day's open, that is, it engulfs the body of the previous day's candle. The wicks of both the candles should be small.
The longer the candle the more bullish it becomes. Additionally, an engulfing is considered more bullish if it engulfs the previous day's high and low as well.
See the image below.
 |
| Schematic diagram showing Bullish Engulfing Pattern |
Now let' see this pattern in charts to have a better idea about this reversal pattern.
In a previous post on candlesticks, I said- every candlestick and candlestick pattern reflects the psychology of traders, the bulls and bears. The engulfing pattern, as well, reflects the psychology of traders. Let's learn the psychology of the engulfing pattern now.
The Psychology behind Bullish Engulfing Candlestick Pattern-
The prevailing trend before the engulfing pattern appears is a downtrend.
The first candle of the pattern is a red candle that signifies the bears are in charge. This red candle suggests the downtrend is continuing.
The second candle opens below the close of the previous candle, that is, a gap-down opening. This gap-down opening suggests the bears are still in control and bulls are weak. However, as the day progresses, the bulls take control and push the price up. The buyers or the bulls then don't lose control for the entire day and the price closes above the previous day's open.
This sudden change in trend occurs near a strong support area where many buyers feel that the price won't go further down and thus start to buy the security. The larger the second candle the more bullish weight it gives to the security or stock.
Now that you have understood the Bullish Engulfing pattern, you might wonder how to go about trading this pattern. Well, you will learn this in the paragraph that follows.
How to trade Bullish Engulfing Candlestick pattern-
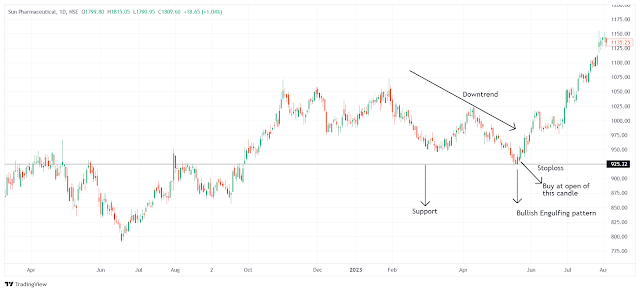
Engulfing patterns can appear anywhere on the chart but the one worth trading will be found in a downtrend and near a strong support area.
Once you have such an engulfing pattern on the chart, you go for a buy on the opening of the next candle, that is, the candle that follows the green candle and put your stop loss below the low of the green candle (the second candle of the pattern).
Let's see this in a chart.
 |
| Daily chart of SUNPHARMA showing Bullish Engulfing Pattern and how to trade this pattern |
A word of caution here. Though the Engulfing pattern is an extremely bullish signal before entering a trade you should make sure that other indicators like momentum indicators, volume indicators, and general price action are in agreement.
I hope you found the post enlightening. In the next post, we will learn about another bullish reversal candlestick pattern- The piercing pattern. Stay tuned !!


Post a Comment