Trend is the fundamental and the most important concept in financial markets. I say it as the most important because trading decisions (whether to buy or sell or don't do anything) largely rest on trend analysis. Furthermore, trend analysis is the initial and one of the most important steps of all the strategies that scores of traders and investors use on a regular basis. No trading strategy is complete unless it incorporates trend analysis in its steps. So, let's take a look at the meaning and uses of trends in the stock market.
The trend is defined as-
" General direction of price of a stock or indices over a period of time."
So, a trend is the direction of price, that is, whether prices are going up or down or flat, over a given period. Let us understand this through an example.
Assume there is a stock called XYZ which was trading at a price of ₹100 three months ago and now it is trading at ₹130. You can say, in this case, that the general direction of the price of stock XYZ in the last three months was up as the price has gone up from ₹100 to ₹130.
If, however, the present price of the stock XYZ is ₹80 (instead of ₹130) you would say the general direction of the price of stock XYZ is down since the price has fallen from ₹100 to ₹80 in the last three months.
Another scenario can be, the prices remaining almost at the same level as it was three months ago. In this case, you would say there is no trend as the price has not moved and remained at the same level. This is called as sideways trend or a rangebound market. These three scenarios have been schematically shown in the image below.
So, from the example above it is clear that based on the direction of movement of price a trend can be classified into three-
1) Uptrend- when the general direction of price movement is up.
2) Downtrend- when the general direction of price movement is down.
3) Sideways trend- when prices remain at almost at same level over a period of time.
Now that you have a very basic idea of trends in stock markets let's go one step further. But in the real market prices don't move in straight lines rather they move in zigzag fashion making a series of waves with peaks (the highest point of a wave) and troughs (the lowest point of a wave) as shown in the image below.
The individual waves in the price chart of a stock is called Swing, the peak or the highest point of a wave is called swing high and the trough or lowest point of the wave is called swing low.
In the image above the swing highs have been marked with the letter "H" while swing lows have been marked with the letter "L".
As you can see in the image above the subsequent swing highs are higher than the previous ones and also the subsequent lows are higher than the previous swing lows. So, you can say the stock is making higher highs and higher lows. This is the characteristic of an uptrend.
In case of a downtrend opposite occurs, that is, the price chart makes lower highs and lower lows. This is shown in the picture below.
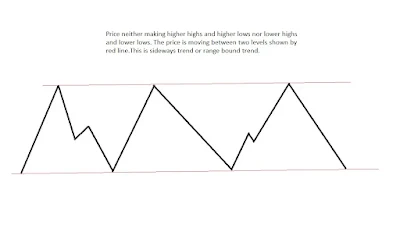
A sideways trend doesn't make any higher highs or lower highs rather the stock price oscillates between two price levels, that is, the stock is range-bound. This is shown in image below.
Now let's take a look at these three kinds of trends in real stock charts.
In the image above you can appreciate that the price of the stock is making higher highs and higher lows. For the purpose of making it simple to understand I have drawn lines between highs and lows and also marked highs with "H" and lows with "L".
In the image above the price is making lower highs and lower lows, thus, the stock is in downtrend.
I hope now you have fair idea of Trend in the stock market and also understood the three kinds of trends based on direction of price. Before we end the post let's take a look at key takeaways from the post-
1) A trend is general direction the price is moving in.
2) Based on direction of movement of price a trend can be classified into three- Uptrend, Downtrend and Sideways Trend
3) In an Uptrend the general direction of price movement is up and it is characterized be higher highs and higher lows on a price chart.
4) In a Downtrend the general direction of price movement is down and it is characterized by lower highs and lower lows.
5) In Sideways trend the general direction of price is horizontal and it is characterized by price oscillating between two levels.
Now before I end the post let me ask a question.
Is it possible that a stock is simultaneously in an Uptrend as well as Downtrend? This would be a fodder for your thoughts till I answer this question in the next post- Comprehensive Guide on Trend in stock Market: Short term, Medium term and Long term trends


Post a Comment